
Updated: October 23, 2025
Table of contents
- Permissions and accessibility
- What is a lead?
- Accessing lead analytics in V2
- "New leads" vs "active leads"
- What determines enrolled leads percentage?
- How to see total leads sign ups in a time period
- See a specific lead program interest analytics
- See lead analytics by source
- See lead analytics by status
- See lead conversion analytics
- Frequently asked questions (FAQs)
- What is the difference between a trial and a lead?
- What do the lead conversion analytics tell me?
- Can I hide the chart?
- What is the "compare to" button?
- A lead opted in while I was on the page but it didn't affect the analytics
- A lead registered for a trial, but it didn't affect the enrolled percentage
- Can I see which participants were part of the opt-in data?
- Can I change the colors in the chart?
- Was this helpful?
Permissions and accessibility
Staff access:
-
Admin: Full access
-
Manager: Based on V1 settings
-
Staff: Based on V1 settings
MyStudio plan restrictions:
-
None
What is a lead?
A lead is an individual who has requested information about your business, but hasn’t engaged in it. They have the potential of becoming trial or recurring members registered to programs.
Accessing lead analytics in V2
To access the lead analytics in V2:
-
In V2, go to insights > analytics section.
-
Click the leads tab at the top.

^ Back to top
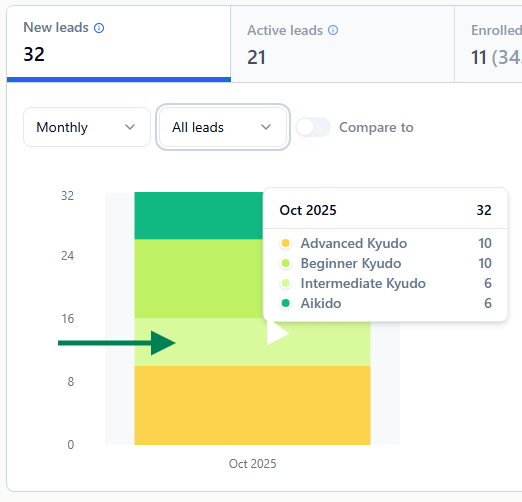
“New leads” vs “active leads”
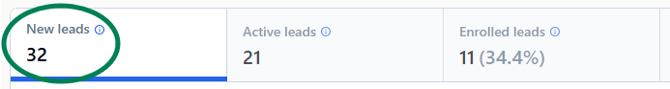
Above the lead analytics chart you’ll see numbers for new leads, active leads, and enrolled percentage.
-
New leads: The number of new leads that enter your business within a time frame.
-
Active leads: The number of your current leads that are active within a time frame.

^ Back to top
What determines enrolled leads percentage?
Above the lead analytics chart you’ll see an enrolled percentage. This percentage is determined by calculating how many leads out of the total number have an “enrolled” status. This is considered a “win” status and counts positively towards the percentage.
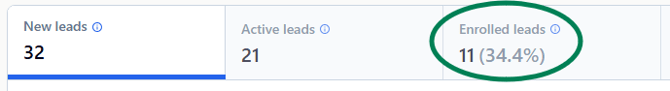
Note: Custom statuses you create do not count towards a “win” status and will not increase the percentage.
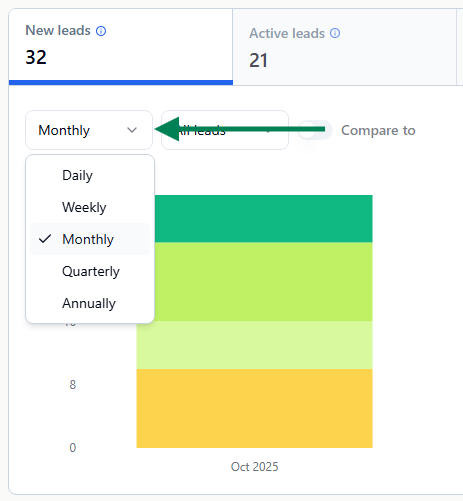
How to see total leads sign ups in a time period
To see total lead sign ups within a specific time period:
-
In V2, go to insights > analytics.
-
Click the leads tab at the top.
-
Above the chart or table, click the time frame drop down.
-
Select the time frame you would like to look at.
^ Back to top
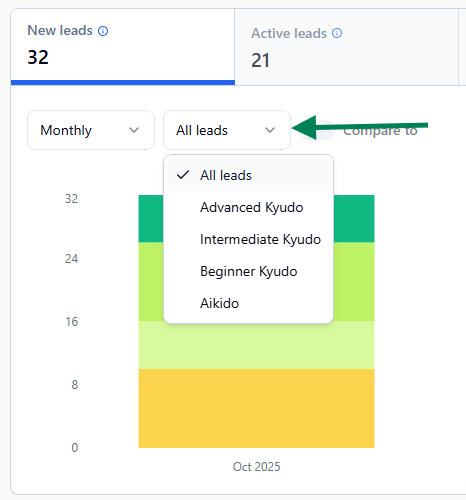
See a specific lead program interest analytics
To see a specific lead program interest’s analytics:
-
In V2, go to insights > analytics.
-
Click the leads tab at the top.
-
Above the chart, click the dropdown for lead program interests.
-
Select the specific program interest you’d like to view.
Note: You can also hover your mouse over the chart column to see the numbers for specific lead program interests or look at the statistics for specific program interests in the drop-downs of the analytics table.
^ Back to top
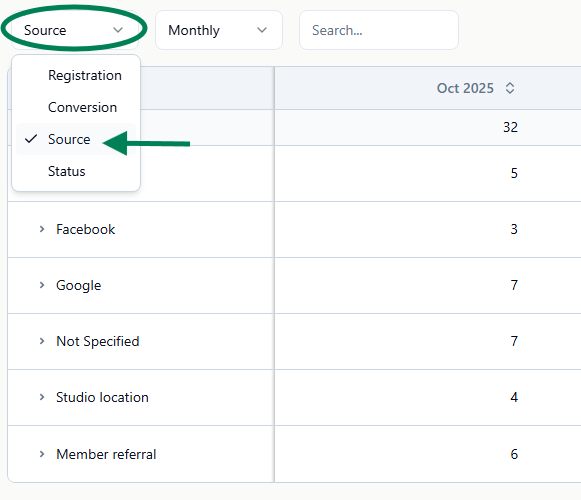
See lead analytics by source
To see lead analytics by sources:
-
In V2, go to insights > analytics.
-
Click the leads tab at the top.
-
In the table below the chart, click the first drop down option (defaulted to “registration”) and select “source.”
^ Back to top
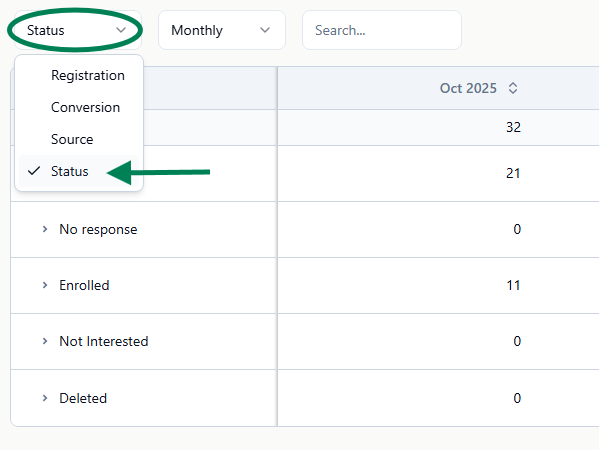
See lead analytics by status
To see lead analytics by status:
-
In V2, go to insights > analytics.
-
Click the leads tab at the top.
-
In the table below the chart, click the first drop down option (defaulted to “registration”) and select “status.”
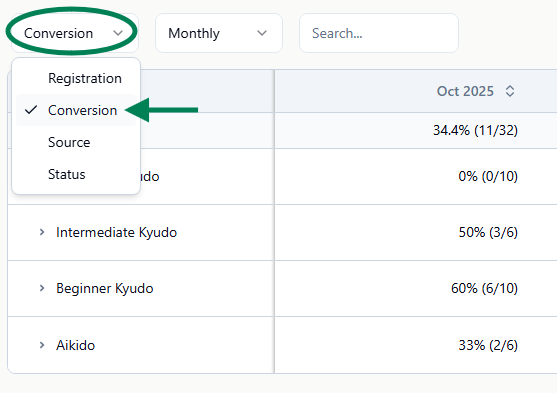
See lead conversion analytics
To see lead conversion analytics:
-
In V2, go to insights > analytics.
-
Click the leads tab at the top.
-
The conversion analytics can be seen above the chart under the “enrolled” percentage, but you can also go to the table below the chart.
-
Click the first drop down option (defaulted to “registration) and select “conversion.” This will show you the conversion rates of each lead.
Frequently asked questions (FAQs)
What is the difference between a trial and a lead?
A lead is an individual who has requested information about your business, but hasn’t engaged in it. A trial is someone who is trying out your services, but hasn’t committed to a recurring membership yet.
What do the lead conversion analytics tell me?
The lead conversion analytics tells you the percentage of leads that end up enrolled in a trial or membership.
^ Back to top
Can I hide the chart?
If you only want a table view of these analytics, click the “hide chart” button at the top right.
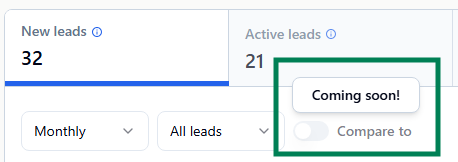
What is the “compare to” button?
The “compare to” button is a feature coming soon that will allow you to compare lead opt-ins between two time periods. For example, you would be able to compare the amount of leads who entered the system this month compared to the same month last year.
^ Back to top
A lead opted in while I was on the page but it didn’t affect the analytics
The analytics page is not dynamic, so you will need to refresh the page to see new enrollments either by clicking the refresh button on your browser, or by clicking the “refresh” button at the top right above the chart.
^ Back to top
A lead registered for a trial, but it didn’t affect the enrolled percentage
Our system doesn’t automatically change the status of a lead by default. You will need to either change the status manually or set up a lead status conversion automation.
^ Back to top
Can I see which participants were part of the opt-in data?
While you can’t see which leads were part of an opt-in data from the analytics section, you can get this information by utilizing the filters in the contacts section. Check out our article here for more info: V2: Lead Contacts
^ Back to top
Can I change the colors in the chart?
Unfortunately at this time you will not be able to change these colors.
^ Back to top